ONE HEALTH QUANTITATIVE METHODS
2.11
Addressing transmission dynamics with numbers
What are the principles governing the transmission dynamics of infectious diseases? They are best understood if we exemplify them with numbers and fill those in to the spreadsheet of a table calculator program.
You can generate your own spreadsheet by following the steps below. Alternatively, you can download the spreadsheet template that we provided for you. Either view it with your own spreadsheet calculator programme or upload it to a free viewer like this. (If you calculate in this free online app, be aware that when you have a lot of formulas and calculations going on in your sheet, a change of variables may need up to 15 seconds to affect all the relevant cells).
You can create your own sheet with this online app, too.
(1) Start by creating the first row of variable names: T (for Time), S (for Susceptibles), I (for Infectious), R (for Recovered), beta (for contact constant $$\beta$$), mu (for birth and mortality rate $$\mu$$) and recovery (for recovery constant $$\delta$$).
(2) In row two, insert the following data for each variable:
T = 0
S = 1000
I = 1
R = 0
beta ($$\beta$$) = 0,001
mu ($$\mu$$) = 0,05
recovery ($$\delta$$) = 0,1
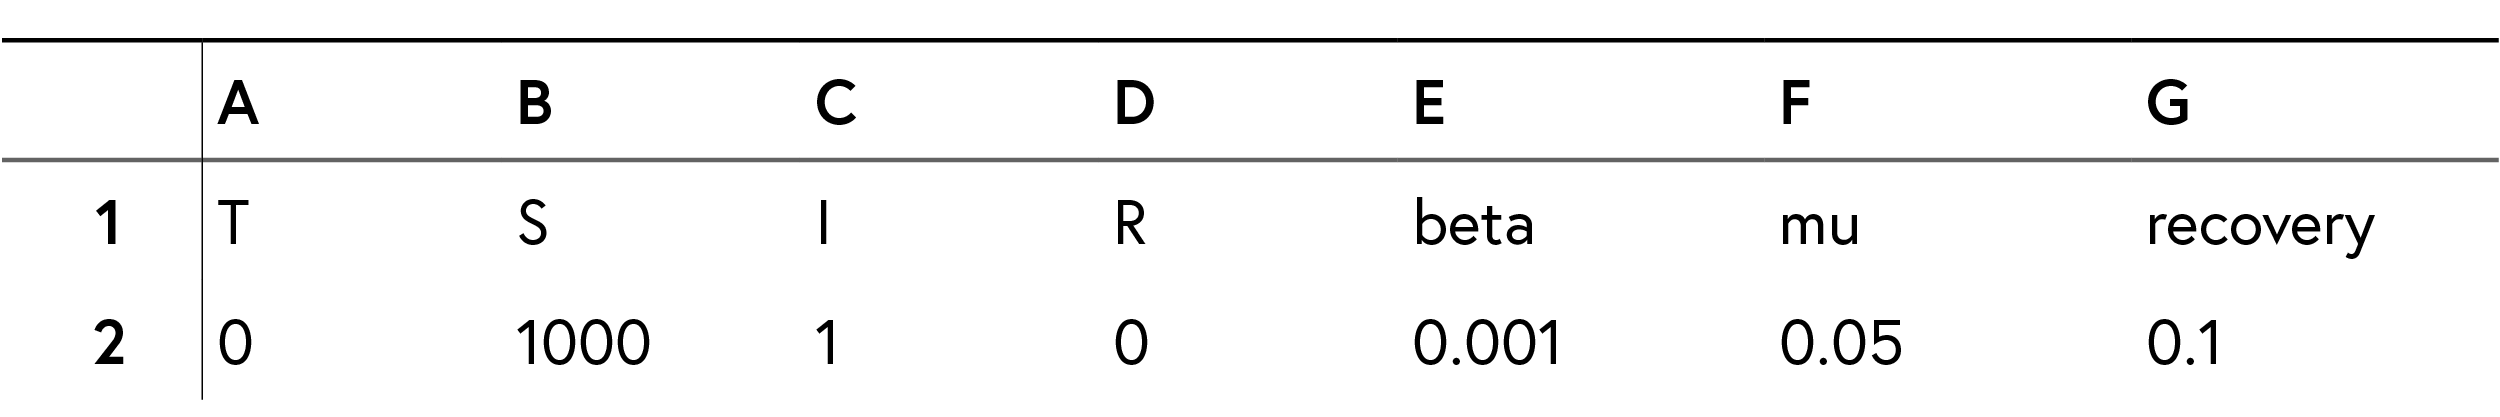 First two rows of the spreadsheet
(3) In row three, write the next time step for $$S_{(t+1)}$$, $$I_{(t+1)}$$ and $$R_{(t+1)}$$ using a variation of the formulas from the previous video step. Important: in these formulas we show how to calculate S, R and I within a population. To calculate these values for the following year, you have to add the values of S, R or I of the the previous year to the formula as shown here:
When referring to a cell that always stays the same (in this case: $$\mu$$, $$\beta$$, or $$\delta$$), we use the the convention of the table calculator program putting $ signs in front of the cell letter and before the cell number, ie $E$2 for beta ($$\beta$$). This is done because when you are copying the formulas to the different years, the spreadsheet will automatically change the target cells for S, R and I but refers always to the same cells for $$\beta$$, $$\mu$$ and $$\delta$$.
(4) Copy the formula for 40 time steps and then plot $$S$$, $$I$$ et $$R$$ contre $$T$$.
What kind of dynamic do you observe? What are the shortfalls of this approach?
You find a solution to this exercise in the following step.
License
University of Basel