ONE HEALTH CASE STUDIES II
5.6
Understand and test capture-mark-recapture methods
In October 2012, we worked in Arrondissement 1 in N’Djamena, Chad, vaccinating 835 dogs, 109 cats and five monkeys against rabies. Each vaccinated animal was marked with a blue plastic collar. We wanted to know the achieved vaccination coverage.
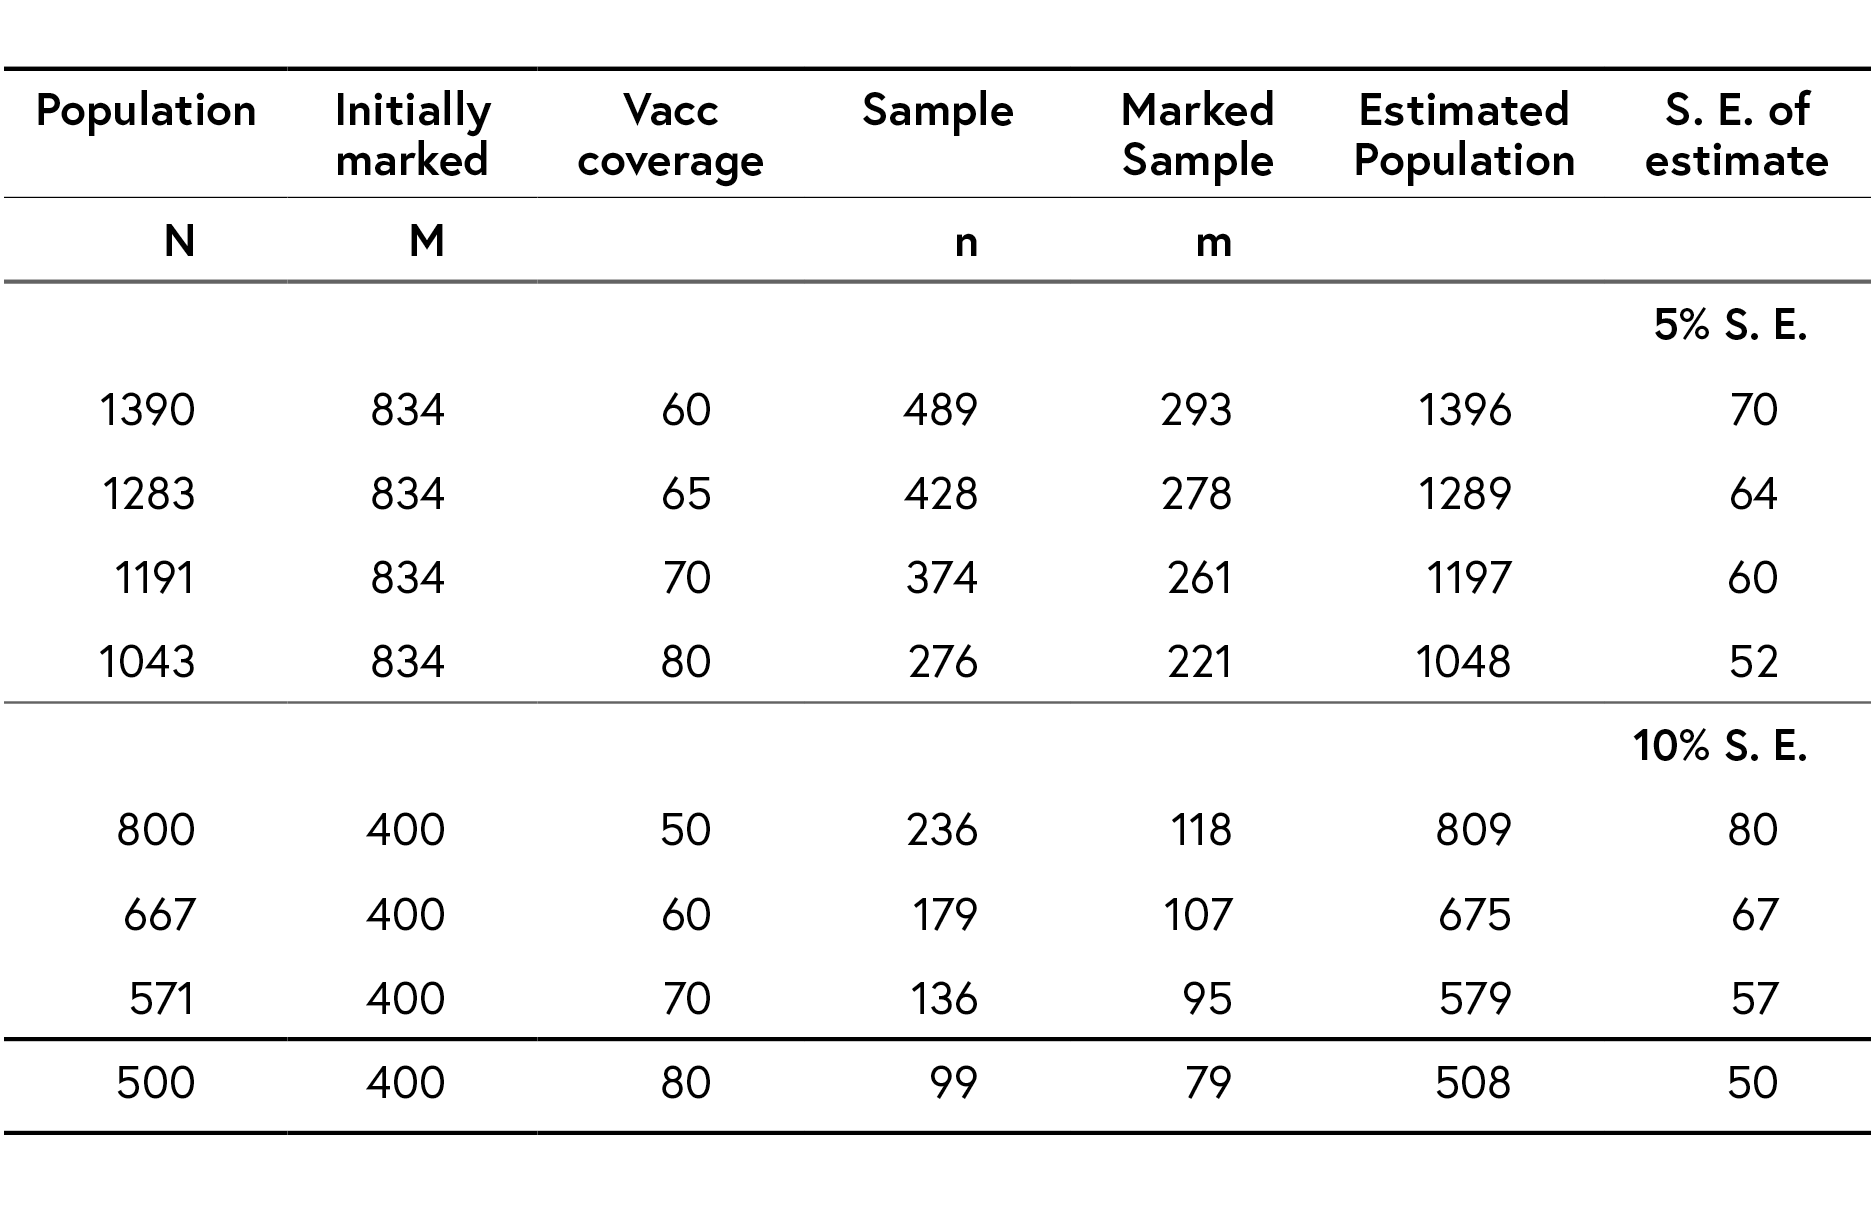
The spreadsheet (see table below) was introduced in the previous step where we calculate the number of dogs to be recaptured in households to establish the vaccination coverage, assuming a coverage of 70%. What is the number of dogs to be recaptured?

Table: recapture sample size, according to Petersen-Bailey
© Swiss Tropical and Public Health Institute
We should find $$m = 261$$ marked dogs. Starting from randomly selected geographical points, we found 392 dogs, of which 255 were marked. This indicates that the total population of dogs in Arrondissement 1 was approximately 1’283 dogs, with a standard error of the estimate of 64 dogs. To achieve 70% coverage of 1’283 dogs, we need to vaccinate 898 dogs. As written above, we had already vaccinated 835 dogs. This indicates a deficit of 64 dogs that were not vaccinated. In the next round of vaccination, we vaccinated an additional 64 dogs and thereby achieved the desired 70% coverage. We carried out the same procedure in all city districts. The results are published online.
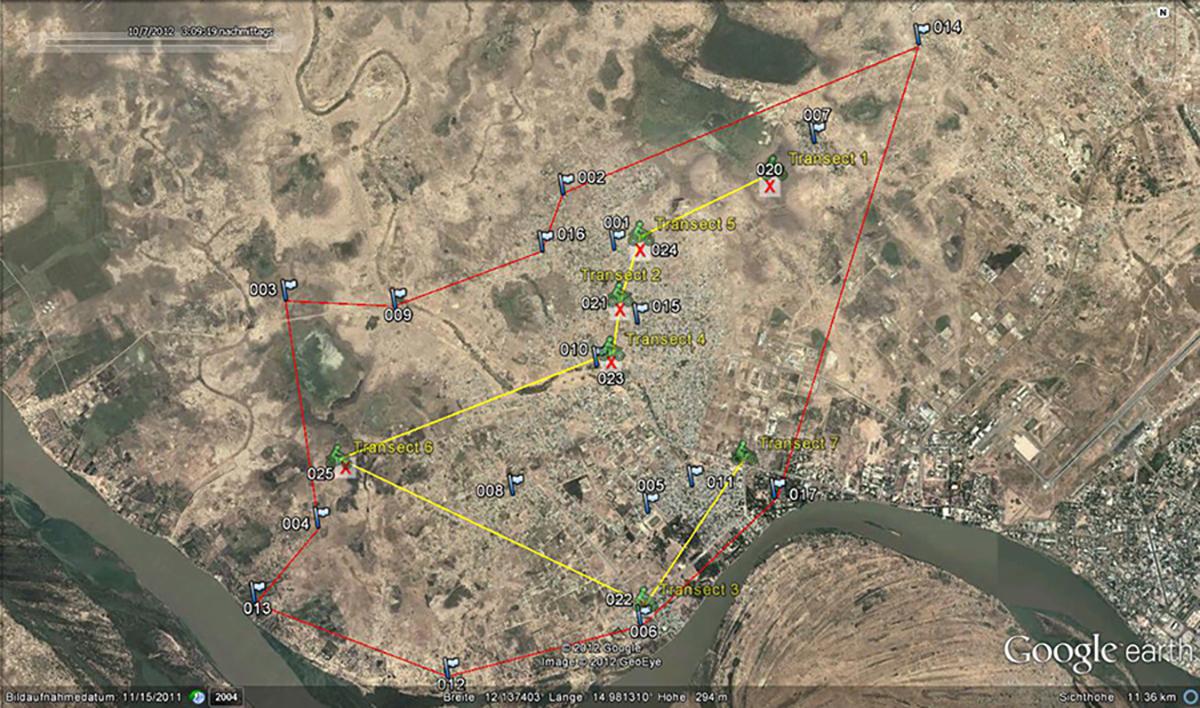
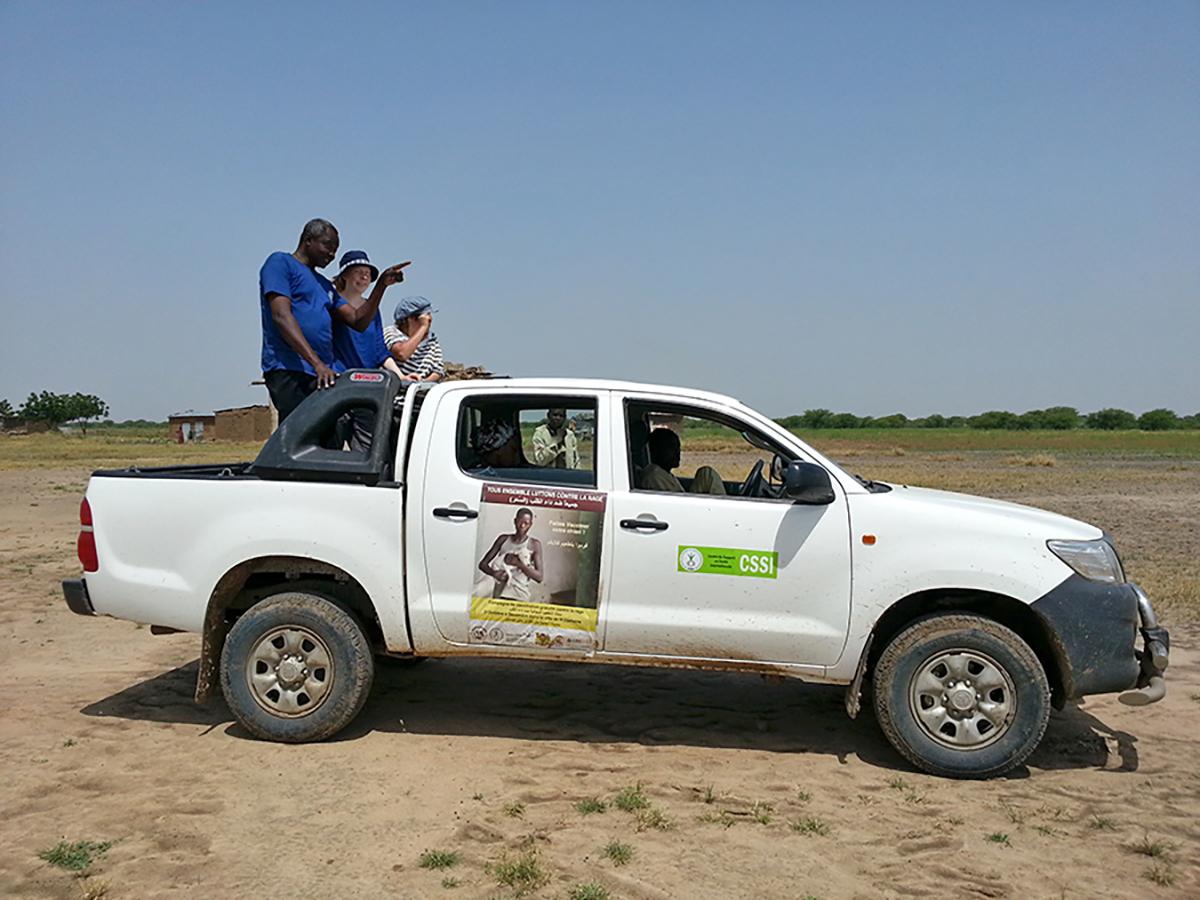
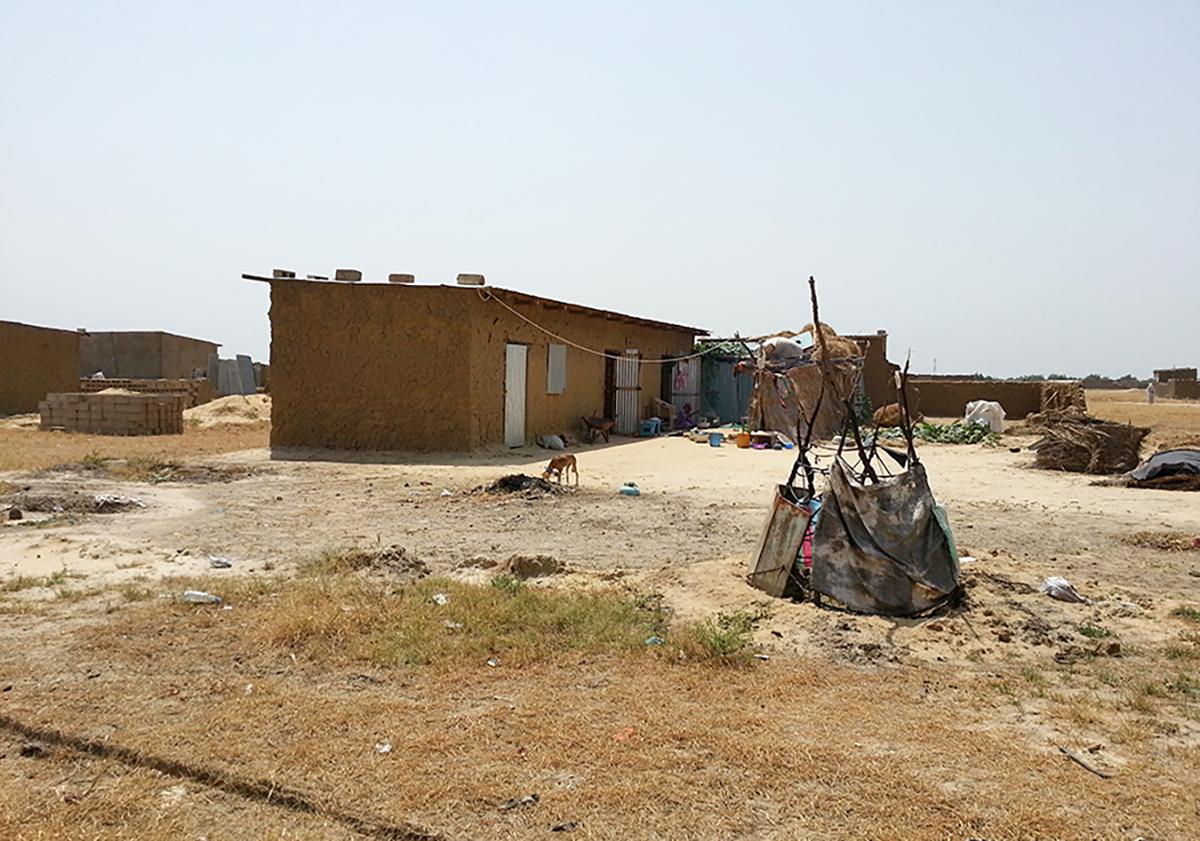
But this is not the end of the story. There is an unknown proportion of ownerless dogs in the vaccination area which are not accessible for vaccination. We need to find a way to estimate the number and add it to the denominator. To do so, we drove along transects (see image one) to count dogs in the street (see images two and three).

Image one: transect line to estimate the unknown proportion of ownerless dogs
© Jakob Zinsstag

Image two: observing dogs in the street in N’Djaména
© Jakob Zinsstag

Image three: a free-roaming dog in N’Djaména - is he vaccinated?
©Jakob Zinsstag
We assume that a proportion of owned and ownerless dogs are in the street at any time. We considered the proportion of ownerless dogs as a latent variable in a Bayesian statistical model. The detailed analysis is beyond the scope of this course. If you have some background in biostatistics, you can read about the estimation of the proportion of ownerless dogs in the published paper. Not more than 15% of the dogs were ownerless, so vaccinating a sufficiently high proportion of owned dogs is sufficient to interrupt transmission and the ownerless dogs can be ignored. If the proportion of ownerless dogs was higher, it would be important to implement a complementary strategy, such as with oral bait vaccination.
References
Léchenne, M. et al. (2016). Operational Performance and Analysis of Two Rabies Vaccination Campaigns in N’Djamena, Chad, in: Vaccine 34(4), 571-577.
Lizenz
University of Basel
