THE BIRTH OF PSYCHOLOGY
3.2
The Weber-Fechner Law
The previous video introduced the Weber-Fechner law. In this step you will explore an illustration that refers to this law.
 (CC BY-SA 4.0; an illustration of the Weber-Fechner law)
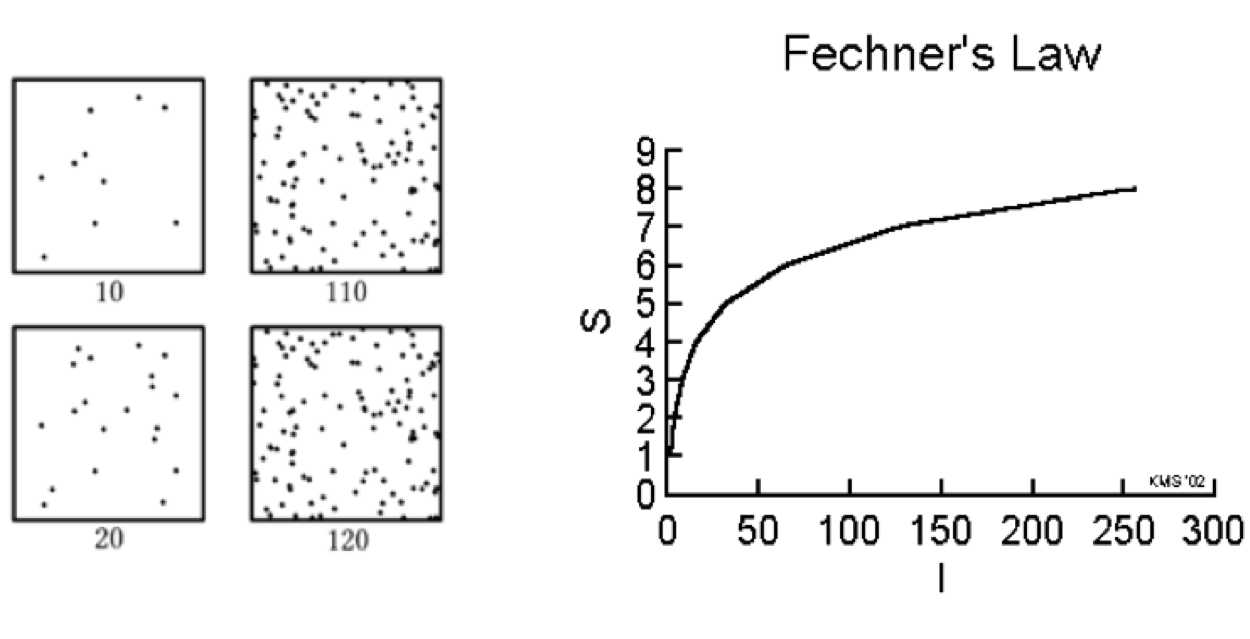
The figure on the left provides an illustration of the Weber-Fechner law that promised to revolutionize the understanding of the mind through formalization. On each side, the lower square contains 10 more dots than the upper one. However, the subjective perception is different: On the left side, the difference between the upper and lower square is clearly visible. On the right side, the two squares look almost the same, despite the number of dots differing by the same amount as the two left panels (10 dots).
The figure on the right depicts the relation between intensity (I) of a stimulus and the subjective experience or sensation (S) and can be modeled by the Weber-Fechner equation, S = K log(I) in which K is a stimulus-specific constant and is to be estimated from data.
Lizenz
University of Basel