STATISTICS AND ANALYSES
4.2
Which test for which hypothesis?
Stats recap
Choosing the correct statistical test is crucial for your experiment. Which test you should use is determined by your study design, your hypotheses, and the type of data you gather. Let’s first revise some important terminology (if you already know what these are you can skip ahead.)
Dependent variables (DV) and independent variables (IV)
In many studies the variables can be classified as dependent variable (also called criterion) or independent variable (or predictor). If you have conducted a true experiment, then the independent variables (IVs) are those that you have directly manipulated, and the dependent variables (DVs) are those you have merely measured. For quasi-experimental designs, the IVs are those variables that you have somehow controlled or selected for (e.g. gender), with the goal of testing how the DV changes as a function of the IVs. However, in some designs you do not have a clear DV and IV, instead you merely want to see whether there is a relationship between two measured variables.
Continuous variables and categorical variables
Categorical variables are variables where each level of the variable is a separate category. These variables are measured on a nominal or ordinal scale.
➔ In nominal scales these categories or levels of the variable cannot be ranked or ordered (e.g. gender = female, male; or nationality = Swiss, Italian).
➔ In ordinal variables the categories or levels of the variable can be ranked or ordered (e.g. degree level = none < Bachelor’s < Master’s).
Continuous variables are measured on interval or ratio scales. In both of these scales not only the levels of the variable are ordered, but also the differences between the levels is in a meaningful unit. That means the difference between level 1 and level 2, is the same as the difference between level 2 and 3 (e.g. temperature in Celsius = 0° < 1° and the distance between 0° and 1° is the same as the distance between 1° and 2°).
➔ Ratio scales have an additional property over interval scales in such a way that they also have a meaningful 0 point (e.g. length in cm, number of correct items).
Rules for determining the right test
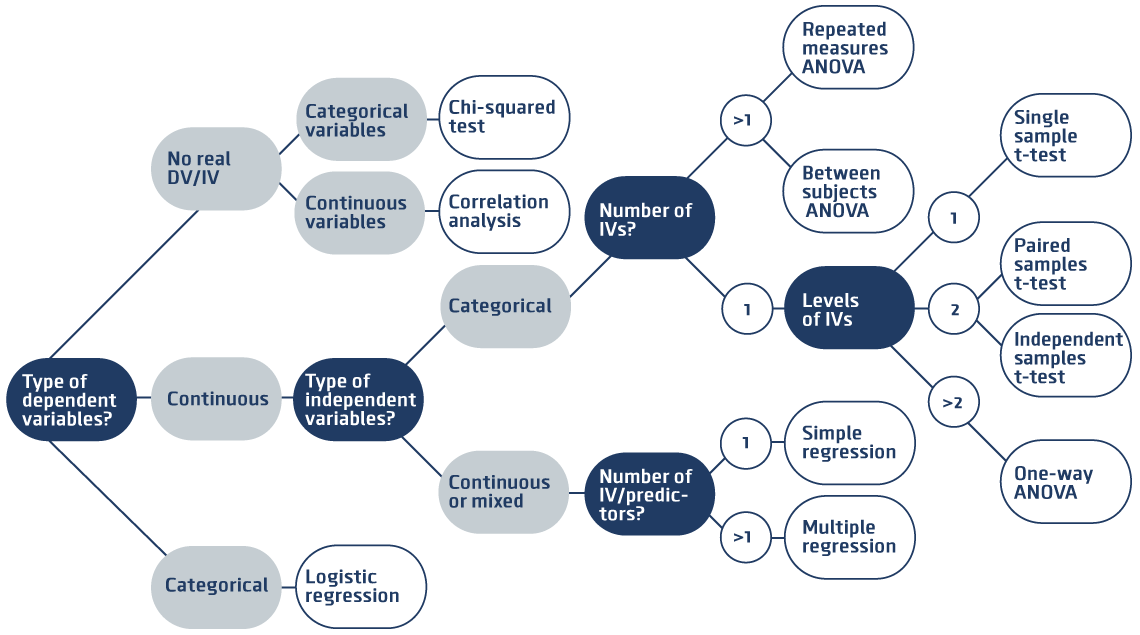
Check out the decision tree below for determining the appropriate test. If you can answer the following seven questions, you should be able to determine which statistical test is appropriate for your experiment:
1. Do I have a clear dependent variable (DV) and independent variable (IV), or am I testing for an association between two variables?
2. Is my DV continuous in nature or discrete/categorical?
3. Do I have more than one IV?
4. Are all of my IVs categorical in nature?
5. Do I have any categorical IVs with more than two categories?
6. Is my manipulation within or between subjects?
7. Do I satisfy the assumptions to use a parametric version of the test?
The first six questions in this decision tree are all based on decisions you made when you were designing your study. So, they should be easy to answer. The last question, however, is used to decide whether you should use a parametric version of the test (those generally shown in the table) or a non-parametric equivalent.
Parametric tests and non-parametric tests
Some statistical test assume distributions of variables, like a normal distribution. The tests are called parametric tests, because they estimate certain parameters from the distribution that they assume to be true.
Alternatively, statistical tests can make no assumptions about the distributions of variables. These tests are called non-parametric tests, because they do not estimate parameters from a hypothetical distribution of the data. Most statistical tests make certain assumptions (without knowing the data) about how the data looks like. Tests need these assumptions to provide accurate results. Here are the three most important assumptions:
Normal distribution (normality assumption): The DV is approximately normally distributed at each level of the IV.
Constant variance (homoscedasticity assumption): The variance of the DV is equal at all levels of the IV. It is also called homogeneity of variance.
Constant differences (sphericity assumption): This assumption is quite similar to homoscedasticity but it is applicable when you have a within subjects/repeated measures design with more than two repeats (i.e., the DV has been measured three or more times for each participant). If we calculate difference scores between any two measures in such a scenario (e.g. pretreat – posttreat), the variance of these differences scores should be the same as any other combination of two measures (e.g. pretreat – followup or followup – posttreat).
When you can not be sure that your DV and IV data generating process follows the assumed distribution for a parametric test, you might use a related non-parametric test. You might either know that these assumptions are incorrect before running your experiment, or you might infer from the data you have collected that they are likely to be incorrect (e.g. checking the residuals are roughly normally distributed). Non-parametric tests can be applied to many datasets, but usually parametric tests allow for a more detailed statement: For instance, the non-parametric test says, ‘Both distribution are different’, while the parametric test can say, ‘The mean of distribution A is higher than that of B’. Further, if the assumptions are met in general, a parametric test will be more powerful, than a non-parametric test.
Decision tree
This decision tree helps you to find the right test for your experiment. How to run the test in R is explained in chapter 4.6 Hypothesis test with R.
Answering the questions
Which Tests do I use if I don’t have an IV and DV?
- If the variables are categorical:
- If they are ordinal variables (think of degree): Spearman Correlation Test
- If they are nominal variables (think of gender): Chi-Squared test
- If the variables are continuous and they are linearly related:
- If the assumptions of homoscedasticity and normality are met: Pearson Correlation Test
- If these assumptions aren’t met: Spearman Correlation Test
Which Tests do I use if my DV is categorical (think of degree, gender)?
- If the IV is also categorical: Chi-squared test
- If the IV is continuous and/or there is more than one IV: Binomial regression, such as a logistic or probit regression.
Which Tests do I use if I my DV is continuous and I have a single categorical IV?
- If the IV has 1 or 2 levels:
- and the manipulation is between-subjects
- Independent Samples t-test if manipulation is between subjects and homoscedasticity and normality assumptions are met.
- If the assumptions aren’t met, a Wilcoxin Rank-sum/Mann Whitney test is appropriate.
- and the the manipulation is within-subjects or the IV has only a single level
- and the IV normally distributed: Dependent/Single Means t-test.
- if normality is not satisfied use a Wilcoxin Sign test.
- and the manipulation is between-subjects
- If the IV has 3 levels:
- and the manipulation is between-subjects
- ANOVA if normality and homoscedasticity are met
- else Kruskal-Wallis Test
- and the manipulation is within-subjects
- Within subjects ANOVA if normality and sphericity are satisfied
- else a Friedman Test.
- and the manipulation is between-subjects
Which Tests do I use if I my DV is continuous and I have a single continuous IV?
- Simple Linear Regression if homoscedasticity and normality assumptions are satisfied and relationship is linear.
- If data is not normally distributed, for instance, if it is positively skewed, you can use box-cox or log transformations to try to achieve normality. However you should be careful when describing the relationship.
Which Tests do I use if I my DV is continuous and I have multiple IVs?
- If all IVs are categorical: Between Subjects ANOVA if all IVs are between subjects and homoscedasticity and normality assumptions are satisfied.
- Repeated Measures ANOVA if all IVs are within subjects and sphericity and normality assumptions are satisfied.
- Mixed ANOVA if some IVs are within subjects and some between subjects. Assumptions of sphericity, homoscedasticity and normality must be satisfied.
- If the assumptions aren’t met for these tests you can apply corrections for some violations, or transform your data (for instance log or box-cox transformations for skewed data) to try to meet normality requirements.
- Otherwise:
- Multiple Linear Regression if homoscedasticity and normality assumptions are satisfied and relationships are linear.
- If data is not normally distributed, for instance if it is positively skewed, you can use box-cox or log transformations to try to achieve normality. However, you should be careful when then describing the relationship.
Other Tests
These are the main statistical tests you are likely to use in your project. However, there are many more complicated tests you might need to use. You may also decide not to use a traditional frequentist statistical test, but use Bayesian Statistics instead. In any case, you should discuss with your supervisor what test is appropriate for your project.
Multiple Comparisons
Another important issue to consider is that of multiple comparisons and contrast effects. Depending on the design of your study, you might be running either the same test on multiple dependent variables, or run multiple tests comparing particular combinations of IV groups. For example, you might have a design with a control group and 2 different treatment groups. You might want to compare each treatment group to the control group, and the two treatment groups to each other. In this case you should start to consider whether you need to correct your alpha level to account for the multiple comparisons you are conducting.
Lizenz
University of Basel