WRITING A SCIENTIFIC REPORT
3.4
Write a results section
Show your results according to APA
This article explains how to report your results according to APA standards. The results section simply reports your results, which means it presents the ‘dry facts’ without much interpretation (interpretation is done in the discussion section). Writing it up is relatively simple, because there are established guidelines.
Present your results as clearly and accurately as possible. The following topics should be covered by your result section:
➔ General information (optional)
➔ How does the data look?
➔ How was the data analyzed?
➔ What was the outcome? What does that tell us?
General information (optional, 1 paragraph)
Some authors start by outlining information that is relevant to all analyses, like the p-value threshold used, statistical programs, or data aggregation. This step is optional. Consider the examples in Mullane et al (2011, p. 314)…
Data analyses were conducted in R (R Development Core Team, 2007).
…and McKenna, Horswill, and Alexander (2006, p. 4):
We used an alpha level of .05 to determine statistical significance. Cohen’s d, f, and w were used to indicate effect sizes, where d values of 0.50 and 0.80, f values of 0.25 and 0.40, and w values of 0.300 and 0.500 refer to medium and large effect sizes, respectively (Cohen, 1992).
Descriptive statistics (1-2 paragraphs, maybe as a table)
The readers need to get to know your data before learning about your analysis. Write one brief sentence about what information was gathered (e.g. reaction times) to avoid forcing readers to go back in the text.
Follow this example in Chen et al., (2014, p. 4):
The result of primary interest was the relationship between how often participants responded Very Sure Old for the superstrong items and the curvature of the ROC function across the old rating levels (the first 3 ROC points) for the ‘standard’ items (studied without the deep processing tasks).
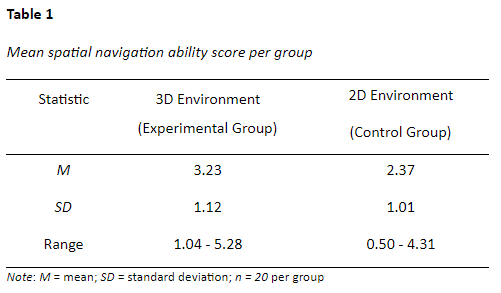
Then describe the variables of interest in your data (no statistical tests yet). Outline in one or two sentences what your data looks like. Describe the main features of your data with descriptive statistics: means (M), medians (MED), measures of variation like standard deviation (SD), and range. Often, small tables are used. You can use this example as blueprint:
Table 1 shows participants’ navigation ability (averaged over participants) for the experimental group in the 3D environment and the control group in the 2D environment.
Inferential statistics (multiple paragraphs)
After describing your data, you are ready to present the results of your analysis. We will show you how to report t-test, ANOVA, and regression results in the examples below. But first, these are the general rules:
➔ Write down in complete sentences which variable you analyzed in which way, and what was the result.
➔ Use the full name of the test (e.g., ‘one-way analysis of variance (ANOVA) for unrelated samples’, instead of ‘ANOVA’).
You can follow this pattern:
The variable X was analyzed with test Y between ABC, revealing RESULT…
After this first part add a comma and report inferential statistics in the following general way:
, statistic (degrees of freedom) = value, p = value, effect-size statistic = value’.
If you do a null-hypothesis test, there are some more general rules you need to follow in the statistics part:
➔ Statistic: exact value of the test statistic (abbreviated to e.g., F, t)
➔ Additional information like degrees of freedom, number of observations in parentheses
➔ Exact p-value associated with your statistic. Report actual p-values, rather than surpassing of thresholds (good: p = .03, bad: p < .05).
➔ Effect sizes
➔ Significance level used and test direction (one- or two-sided)
How to report t-tests, ANOVAs and regressions
Present your t-test results similar to this example adapted from McKenna, Horswill, and Alexander (2006, p. 4):
There were no significant differences between the trained and untrained groups in age, t(77.16) = 0.72, p = .38 (ns), d = 0.15; years elapsed since the driving test was passed, t(82.31) = 0.86, p = .11 (ns), d = 0.18.
Note: t is the name of the test-statistic; 0.72 is the t-value; 77.16 are their degrees of freedom, ns means not significant, d = 0.18 is their Cohen’s d value (effect size).
Present a repeated-measures ANOVA like the example adapted from Su et al (2013 p. 7):
Decision times were analyzed with a 3 (task: single-play probability task, multiple-play probability task, proportion task) x 2 (computational difficulty: high, low) repeated-measures analysis of variance (ANOVA). The results revealed a significant effect of task, F(2, 96) = 96.05, p < .001, η2 = .67, on decision time.
Note: F is the name of their test statistic; 2 and 96 are degrees of freedom; 96.05 is their F-value, η2 is the effect size.
Present between or within-subjects ANOVA results as shown in this example in Yang and Lewandowsky (2003, p. 666).
Training performance was analyzed using the proportion of correct responses in each block as the dependent measure. A 2 (condition) x 10 (training block) between-within analysis of variance (ANOVA) revealed a significant main effect of block, F(9, 540) = 51.193, MSE = .009, p < .001, along with a marginal main effect of condition, F(1, 60) = 3.889, MSE = 0.103, p = .053.
Note: F is the name of the test statistic; 51.193 is their F-value; 9 and 540 are the degrees of freedom; MSE = mean-squared error of the ANOVA.
Present regression analysis results as Gino and Ariely (2012, p. 449):
This analysis revealed that creativity as an individual difference was positively and significantly associated with dishonesty, B = 0.48, SE = 0.084, ß = .51, t = 5.73, p < .001, whereas intelligence was not, B = 0.059, SE = 0.086, ß = .062, t = 0.695, p = .49.
How to format numbers
Make sure that your numbers are displayed correctly. Here are some rules:
➔ Use a point as a decimal separator (1.14 instead of 1,14).
➔ Statistical abbreviations, such as M, SD, or p, as well as their values are written in italic.
➔ The 0 before the decimal separator is omitted for numbers between 0 and 1 (e.g. p-values: .012, .01). If the number is not between 0 and 1, the 0 before the decimal separator is written.
➔ Round decimal numbers to 2 or 3 decimal places (be consistent). Always round up p-values (p-value of 0.051 to p = .06, not p = .05).
➔ Report exact p-values, not surpassing of thresholds. Exception: if you have a very small p-value below 0.001, then report p < .001 (e.g. p-value of 0.00099 is reported as p < .001, not p = .001).
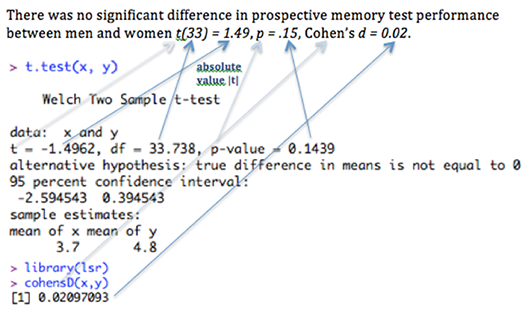
Where to find the statistics in R
If you are working with R it is not always easy to find the corresponding numbers to your results.
Here is an example where to find the statistics in R if you are reporting a two sample t-test:
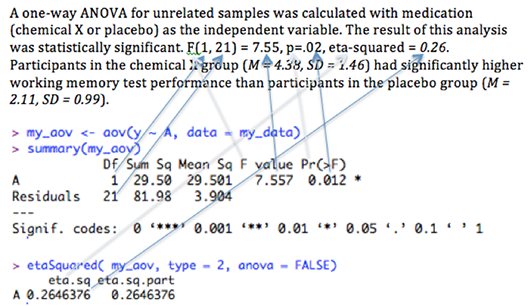
If you are reporting a one-way ANOVA, you can use this example:
Tables and figures
Tables and figures can be very useful for presenting your results. Let’s talk about the content of tables and figures (you can find out how to format them in the beginner’s guide to APA that we compiled for this course). A lot is said about the proper graphical presentation of data in scientific papers. Here are some basic tips to get you started:
➔ Do not copy-paste tables produced with statistical software, they usually contain redundant information and are not formatted suitably for a scientific thesis or manuscript. Instead, identify the relevant information and report it according to the guidelines listed above.
➔ All tables and figures should be labeled with Arabic numbers, in order of appearance in the text (e.g. Table 1, Table 2, Figure 1, Figure 2). Note that the first letters are always capitalized, have a meaningful title and have self-explanatory entries or contain a note of explanation below them (such as in Table 1 we presented to you as an example above).
➔ Every table and figure needs to be referred to in the text, but do not repeat the full table or figure content in the text.
References
Chen, T., Starns, J. J., Rotello, C. M., Chen, T., Starns, J. J., & Rotello, C. M. (2014). A violation of the conditional independence assumption in the two-high-threshold model of recognition memory. Journal of Experimental Psychology: Learning, Memory, and Cognition. doi:10.1037/xlm0000077
McKenna, F. P., Horswill, M. S., & Alexander, J. L. (2006). Does anticipation training affect drivers’ risk taking? Journal of Experimental Psychology. Applied, 12, 1–10. doi:10.1037/1076-898X.12.1.1
Su, Y., Rao, L.-L., Sun, H.-Y., Du, X.-L., Li, X., & Li, S. (2013). Is making a risky choice based on a weighting and adding process? an eye-tracking investigation. Journal of Experimental Psychology: Learning, Memory, and Cognition, 39, 1765–1780. doi:10.1037/a0032861
Yang, L.-X., & Lewandowsky, S. (2003). Context-gated knowledge partitioning in categorization. Journal of Experimental Psychology: Learning, Memory, and Cognition, 29, 663–679. doi:10.1037/0278-7393.29.4.663
License
University of Basel